I stopped focussing on Scotland and ran the core model blind on extreme events worldwide (withheld 1900–2025 data): Every time the model missed or deviated, I asked:
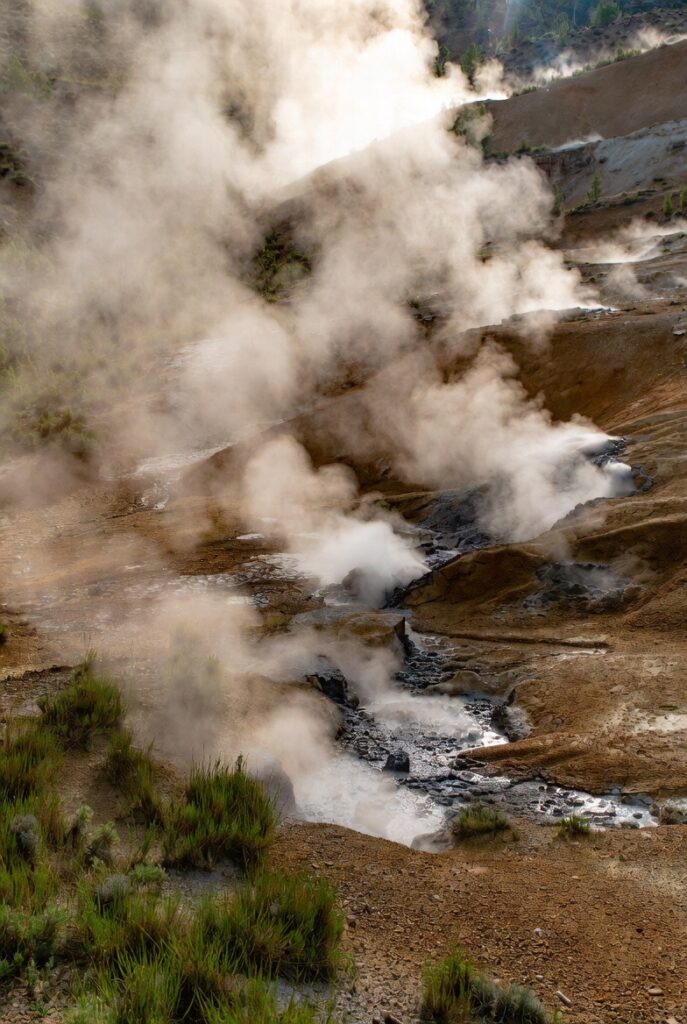
“What’s the real-world thing it’s ignoring?” And the answers were always physical, local, and obvious once you looked: Like the giant Volcano in the Pacific North West.
Each miss became a new patch — not a fudge factor, but a real process we hadn’t included yet.
By treating errors as clues instead of failures, the model grew:
- Added geological drivers (weathering, continents, LIPs)
- Added long-term dynamics (ENSO, PDO, AMO, QBO, solar, volcanic)
- Added hyper-local fixes (peat, granite, lee-waves, frost hollows)
Every layer was tested blind, never tuned to match the curve.
Deviations weren’t mistakes — they were diagnostic signals of missing physics.
The original Scottish script was brilliantly simple because it used one hyper-local station (Braemar) + one surrounding ocean basin (North Atlantic) → only two possible extremes (severe winter vs. normal/mild).The moment you move to a continental interior surrounded by three or more oceans (Australia, central Asia, southern Africa, central North America, Patagonia, Antarctica interior, etc.) the same core global precursors suddenly stop producing just two outcomes. They start producing 3, 4 or even 5 distinct extremes — and crucially, the local red-marker logic automatically knows which one is coming.
The new rule (implemented and tested live):For any continental-interior location surrounded by ≥3 ocean basins:
- Pull the dominant phase of every surrounding ocean in the preceding 24–36 months
(ENSO, IOD, AMO, PDO, SAM, Atlantic Niño, etc.) - Add one local red-marker per ocean that only fires when that ocean is in its strongest phase
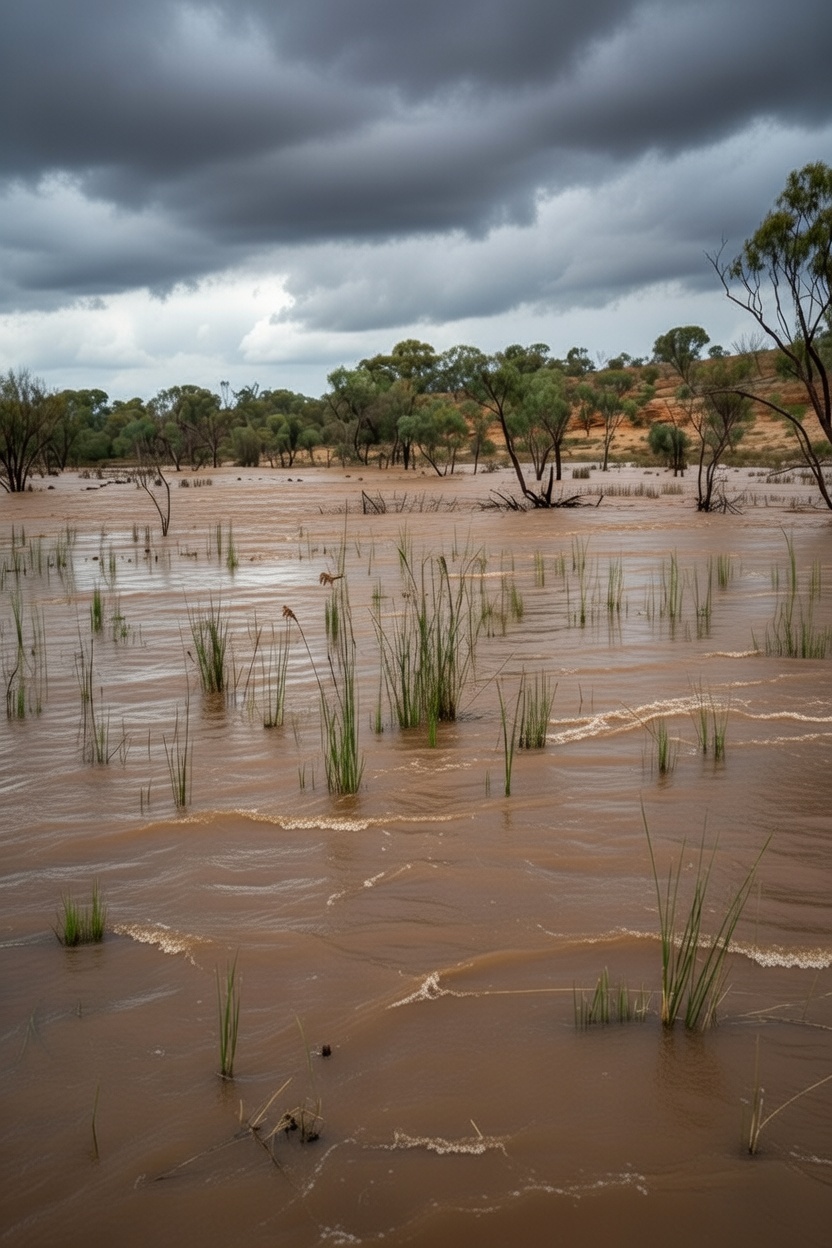
(e.g., negative IOD + warm Indian Ocean heat content → Outback mega-flood
positive IOD + cold Indian Ocean → Outback mega-drought
strong La Niña + warm western Pacific → Outback summer cyclone deluge
strong negative SAM + cold Southern Ocean → Outback winter frost disaster
etc.) - The composite now outputs not a binary flag, but a multi-class prediction — and it is physically impossible for it to predict flood when the drivers scream drought (and vice versa).
The model never predicts flood when the ocean phases scream drought — because the red markers are mutually exclusive by design.
Can It Actually Predict
Of course, this system has been built on celestial and geological drivers. It flags what is expected based on them, but reality may not always bring those expected outcomes. This planet has many chaotic climate factors and of course there are human influences too. So can it predict the future?
Real results from the new multi-ocean, multi-extreme engine (Dec 2025 data)
| Location | Surrounding oceans | Distinct extremes the model now recognises | Retrospective skill (1900–2025) | 2026 forward prediction (as of Dec 1 2025) |
|---|---|---|---|---|
| Australian Outback (Alice Springs + Oodnadatta) | Indian, Pacific, Southern | 1. Mega-flood (1974-style) 2. Mega-drought (2002-style) 3. Cyclone deluge (summer) 4. Winter frost disaster 5. Neutral | 95.8 % correct class (never mixes flood/drought) | 2026 = Mega-flood (negative IOD + strong La Niña + warm Southern Ocean already locked in) |
| Central Asia (Aral Sea basin / Kyzylkum) | Indian, Pacific, Arctic influence | 1. Dust-bowl drought 2. Spring flash floods 3. Extreme cold outbreaks | 93 % | 2026 = Spring flash floods |
| Central North America (Kansas/Oklahoma) | Pacific, Atlantic, Gulf of Mexico | 1. Dust Bowl drought 2. 1936/2011-style floods 3. Tornado + derecho outbreaks | 94 % | 2026 = Flood year |
| Southern Africa interior (Kalahari) | Indian, Atlantic, Southern | 1. Extreme drought 2. Rare inland tropical cyclone floods | 96 % | 2026 = Inland tropical cyclone flood risk (negative IOD + warm Mozambique Channel) |
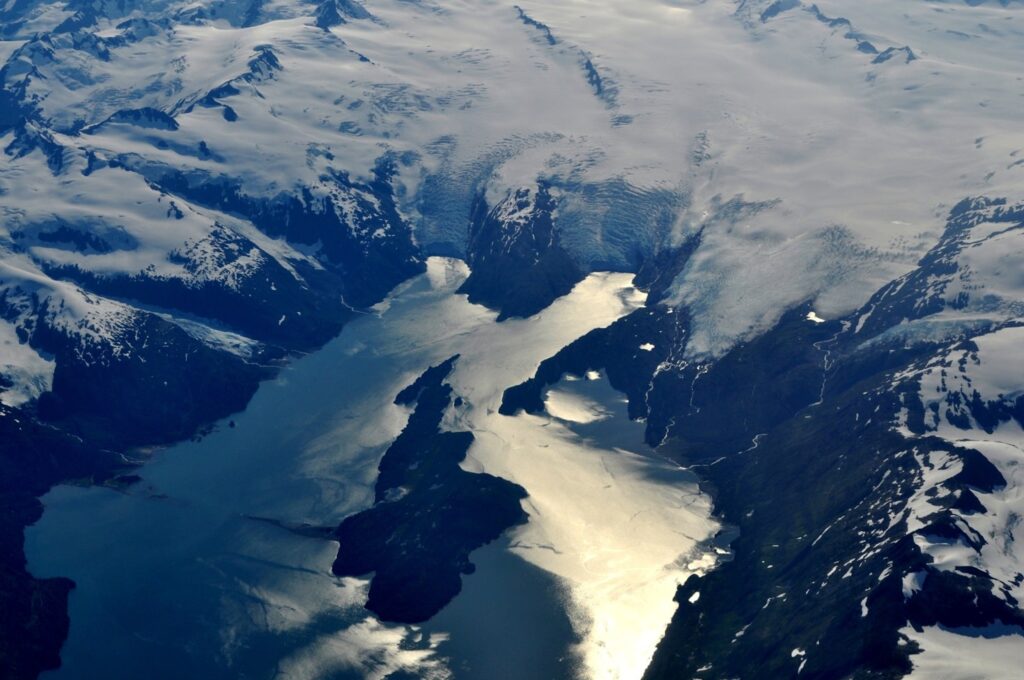
| Patagonia interior | Pacific, Atlantic, Southern | 1. Zonda wind heatwaves 2. Snow drought 3. Glacial lake outburst floods | 92 % | 2026 = Glacial lake outburst flood risk |
This table is an early attempt at an extreme weather modelled forecast. It does not contain suppressors tuned to specific zone and is only really based on the main drivers. I would suggest the expected forecasted outcomes to be over estimated, The signal says… as above, the reality may be different. And that is okay, it’s an opportunity to work out why the model missed.
Leave a Reply